Below is an example of the type of report we deliver. This sample is based on a one-month warehouse optimization assessment completed for a U.S. beverage distributor.
Executive Summary
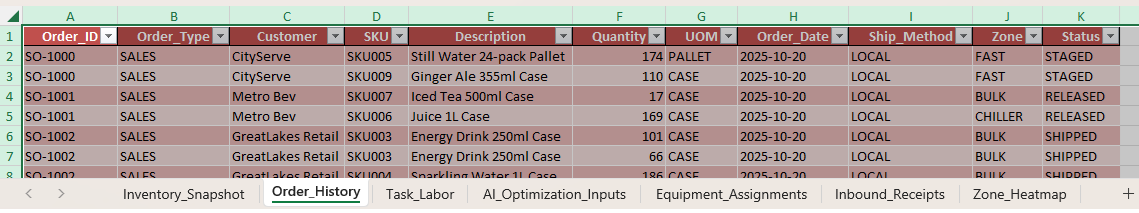
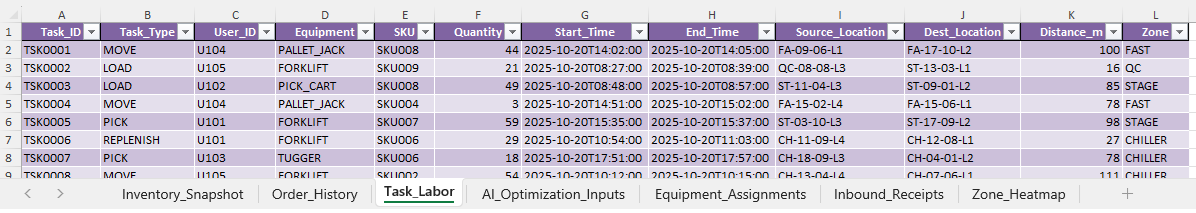
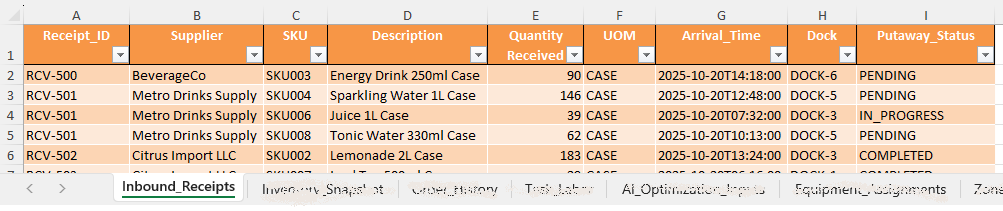
Foysonis analyzed 4 weeks of operational data from a mid-size beverage distributor, including order activity,
inventory position, task history, putaway timing, and staging behavior.
The objective was to identify immediate throughput gains without adding headcount or physical expansion.
Key opportunities were identified in travel efficiency, staging congestion, labor balance, and dock-to-stock cycle time.
Based on current volume and labor cost, the recommended actions represent an estimated
$285K annualized productivity and capacity benefit with a 6–8 month payback.
Operational Impact Snapshot
28%
Reduction in average travel distance per pick task
Drives higher picks/hour and faster order turnaround.
30%
Staging congestion reduction
Improves outbound flow and door availability.
2.4×
Faster putaway cycle time
Shorter dock-to-stock makes inventory pickable sooner.
15–25%
Labor productivity improvement
Achieved through task orchestration and workload balance.
1. Operational Flow Assessment
We measured how time is spent between receiving and shipping — including travel, waiting, and handoff friction.
68m
Average travel distance per task
7.16 min
Average task duration
Key Findings
- Pickers were walking product from FAST zones to STAGE instead of flowing directly to load, creating unnecessary transport loops.
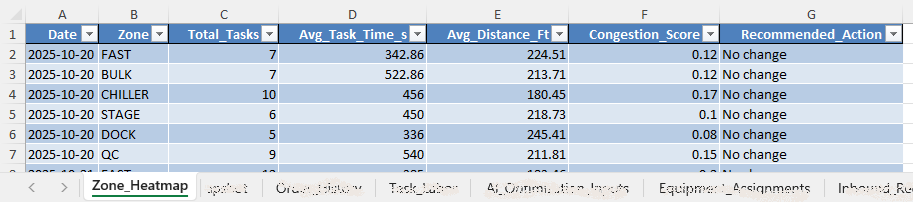
- Recurring congestion was observed at STAGE and FAST during outbound waves, causing travel delays and idle time.
- Travel path length (avg ~68m per task) is higher than expected for this SKU velocity profile.
Why It Matters
Every additional foot walked is time not spent moving product.
Reducing excess travel directly increases picks/hour without adding headcount.
Recommendation:
Re-slot top movers closer to outbound staging, enforce direct-to-load handling for certain SKUs, and level wave timing to avoid peak path congestion.
2. Space & Slotting Utilization
We compared SKU velocity to physical placement to identify forward pick and replenishment opportunities.
High-Velocity SKUs Identified
- SKU002 (Lemonade 2L Case): ~21 picks/day
- SKU009 (Ginger Ale 355ml Case): ~21 picks/day
- SKU004 (Sparkling Water 1L Case): ~18 picks/day
Key Findings
- High-velocity SKUs are not consistently located in fast-pick / low-travel zones.
- Operators with equipment (forklifts, pallet jacks) are spending time on repetitive case pulls.
- Pick path distance can be reduced ~28% by repositioning top-volume SKUs into optimized forward pick locations.
Impact
Slotting the top 20% of SKUs into properly maintained forward pick areas can reduce path distance by 40–50%,
while freeing lift drivers for higher-value work.
Recommendation:
Establish a protected forward pick zone with defined replenishment triggers for A-movers.
3. Labor Productivity & Workload Balance
We reviewed task allocation by user, equipment usage, and shift timing to identify under/over-utilization.
Task Distribution by User (Monthly)
- User U104: 90 tasks (~47% above site average)
- User U103: 76 tasks
- User U101: 68 tasks
- User U102: 64 tasks
- User U105: 61 tasks (baseline)
Key Findings
- One operator (U104) is consistently absorbing high-effort pallet jack / staging work.
- Labor is not balanced across shifts, which creates burnout risk and throughput variability.
- Operators are context-switching (pick → load → replenish), which reduces pick rate per hour.
Why It Matters
A 47% workload imbalance becomes your soft ceiling. When one person is the limiter,
the building can’t scale output without adding headcount.
Recommendation:
Implement task orchestration based on proximity and equipment, rather than manual radio assignment.
This typically yields a 10–15% gain in throughput per head.
4. System & Data Readiness
We evaluated inventory status, hold volume, and flow through staging to determine readiness for automation and AI-driven orchestration.
Key Findings
- ~1 in 11 locations is blocked as HOLD with no consistent reason code.
- ~21% of inventory is RESERVED — product spoken for but not yet shipped — tying up staging space.
- Only ~36% of receipts were fully put away at snapshot, which is forcing docks to act as overflow storage.
Why It Matters
When inventory sits in a “limbo” status (Reserved / Hold / Staged), it’s not sellable, not billable, and not moving.
That’s tied-up cash and tied-up floor space.
Recommendation:
Add disposition codes for HOLD, trigger early LOAD tasks for RESERVED, and auto-generate putaway tasks at receipt close.
This accelerates dock-to-stock and prevents staging from becoming long-term storage.
5. Recommendations & ROI Snapshot
We provide a prioritized roadmap with operational benefit, effort level, and expected time to value.
$285K
Estimated Annual Savings
15–25%
Productivity Improvement Range
Top Priority Actions
- Reduce Travel: Re-slot high runners and enforce direct-to-stage handling. Goal: cut avg path per task below 50m.
- Accelerate Putaway: Move from 36% to 80% same-shift putaway completion to free dock capacity.
- Rebalance Labor: Remove the 47% load gap between top and bottom operators to stabilize throughput.
- Protect Staging Capacity: Reduce STAGE dwell time and RESERVED backlog to keep doors available.
Timeline
Month 1: Slotting + putaway discipline (8–10% gain)
Month 2: Task orchestration rollout (additional 5–8%)
Month 3: Full optimization with AI-driven prioritization (reach 15–25% total improvement)
Bottom Line:
These improvements do not require building expansion or additional headcount. They are process, layout, and system orchestration changes you can act on in weeks.
Download Full Report PDF (Sample)
Includes all supporting visuals, path analysis, and labor distribution detail.